TDAI Launches Data Literacy Series to Meet Demand for Data Training

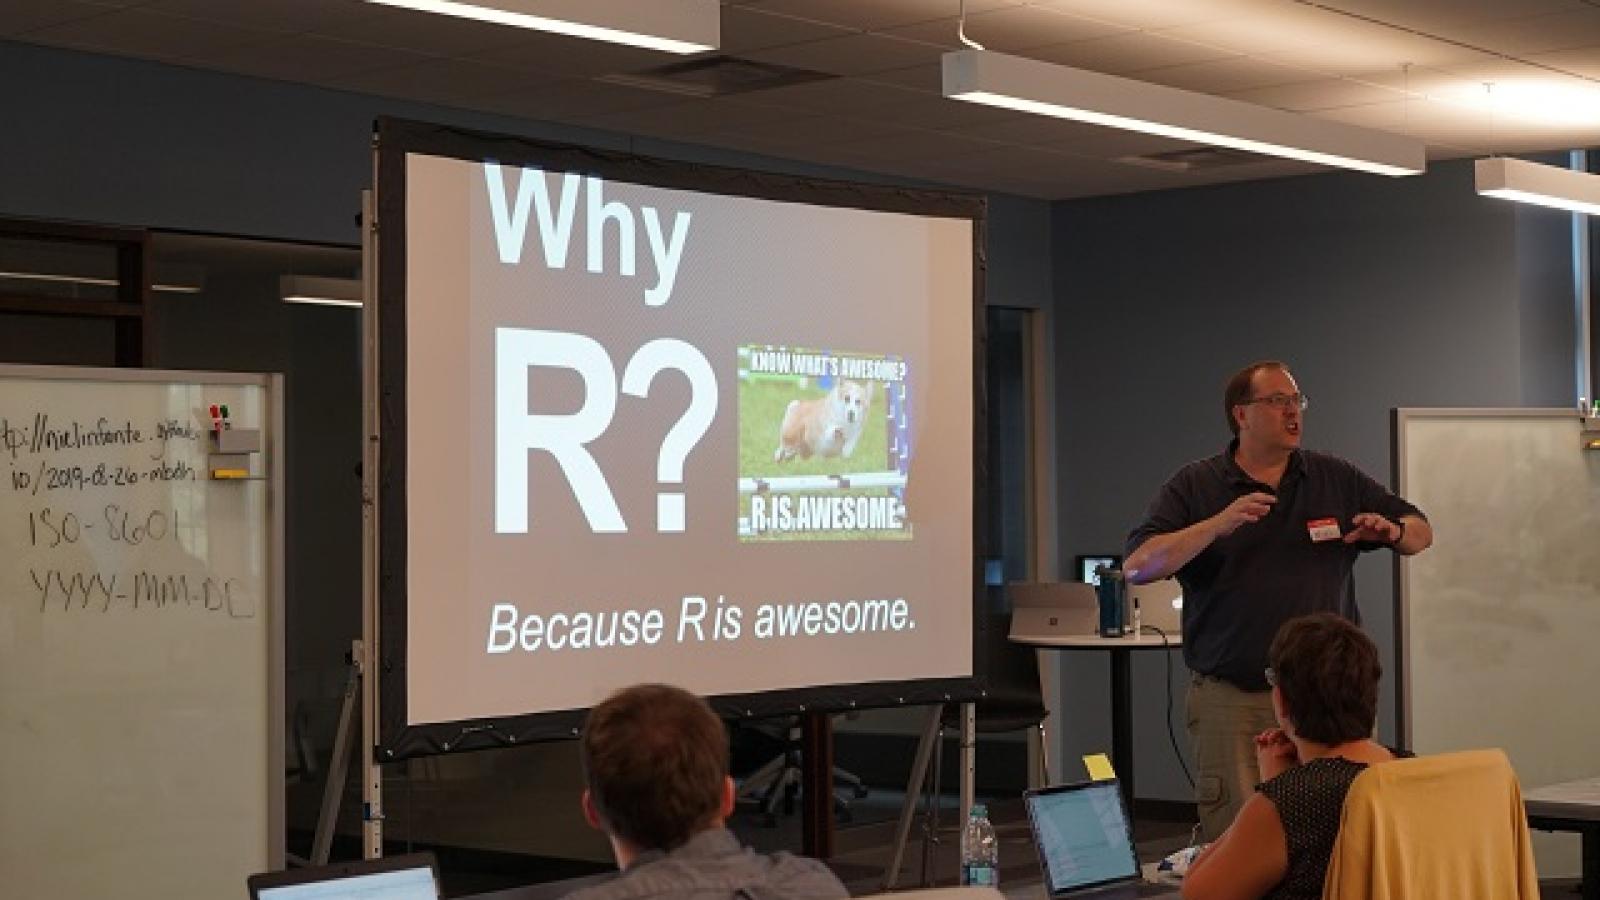
In the Summer of 2019, TDAI was presented with an opportunity from the Midwest Big Data Hub to host an event with the Data Carpentries, an international, non-profit organization where volunteer instructors teach coding and data skills worldwide. Steve Chang, technology lead for TDAI and one of the co-founders of the Series noted, “We had an overwhelming response when we offered this opportunity to the campus community. Our 25-seat room was filled, with 99 additional participants on the waitlist. It was evident that there was a need for these kinds of workshops, and in order to fill this need, the Data Literacy Series was launched.”
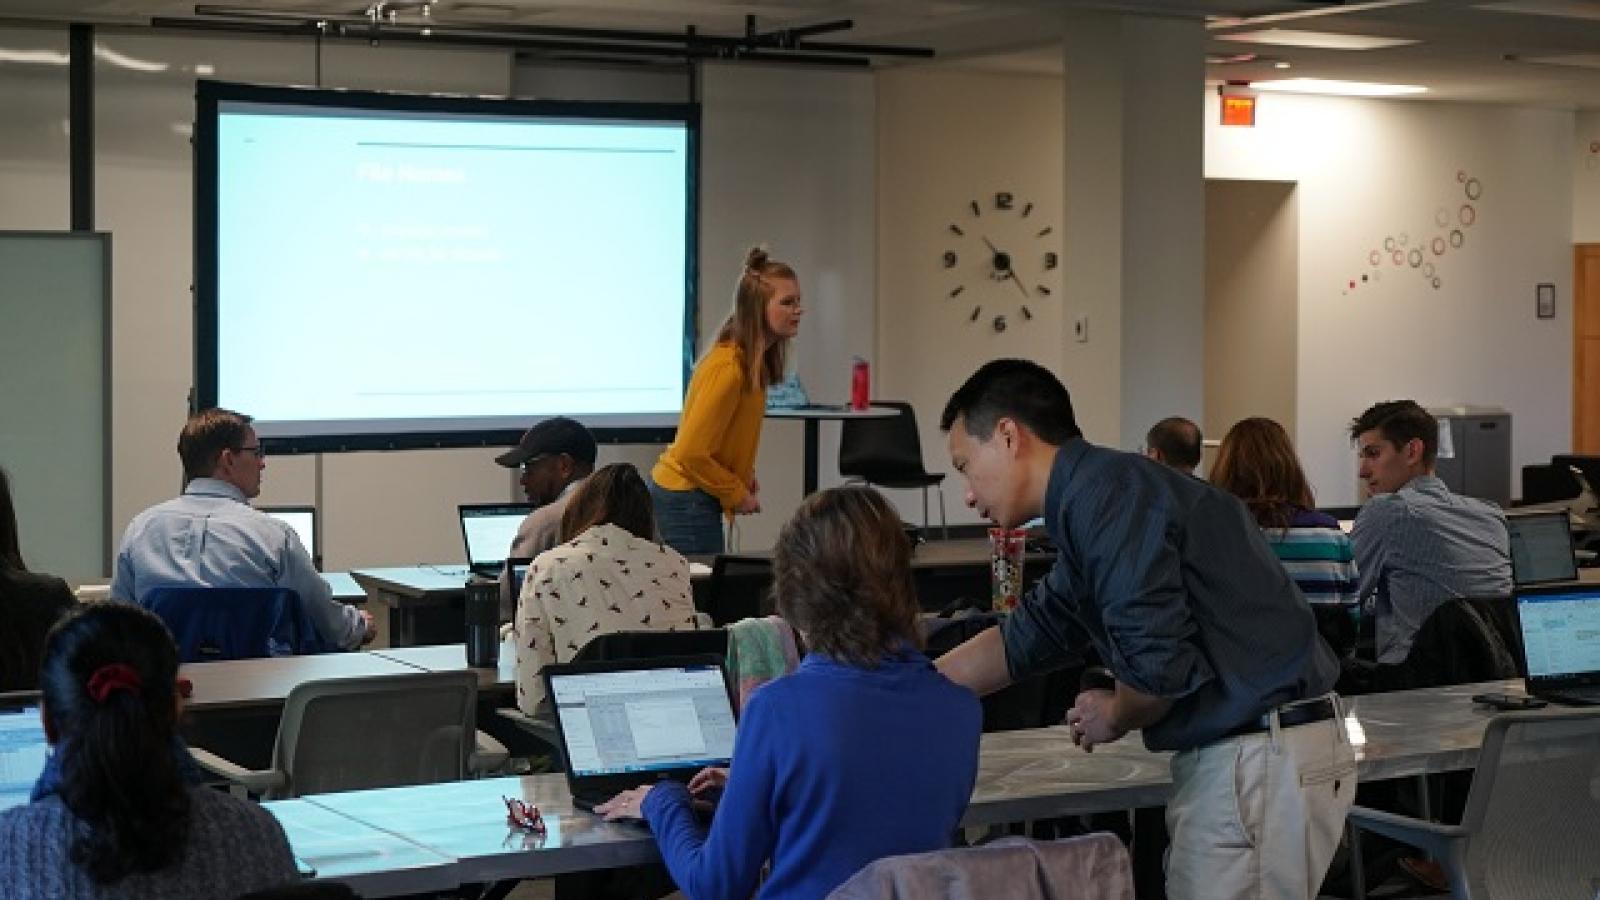
In early 2020, TDAI launched the Data Literacy Series, a four-part training series focused on getting started in R, R for statistical analysis, and data visualization. During the first 20 sessions, the Series has taught more than 200 students, postdocs, faculty, and staff members across more than 30 colleges and departments on campus. Their backgrounds and affiliations included aerospace engineering, business, entomology, pharmaceutics, and even veterinary medicine.
Rachael Giglio Ph.D., a postdoctoral researcher in the Department of Evolution, Ecology, and Organismal Biology, helped facilitate sessions of the Data Literacy Series workshops over the past year and was pleasantly surprised to see the diversity of the participant’s research fields. “I knew that there was a general need for data training and workshops in my fields of interest (genetics, ecology, and evolutionary biology), but I was really surprised by the number of people from diverse fields who were on the waitlist for the workshops each time the series was advertised,” Giglio noted.
The series was co-developed with the Research Commons with the goal of giving participants a better understanding of how to use R as an important tool in their research or daily work. Each of the sessions are designed to provide the building blocks for understanding data analysis, platforms and tools used in field, and visualizing data. Curriculum for each of the sessions was designed to be applicable students, faculty, and staff – regardless of their background.
“Data is created and used at Ohio State every day, but knowing how to use that data is critical,” said Jenna McGuire, Associate Director of TDAI and co-founder of the series. “The Data Literacy Series allows anyone across campus to learn the basics of data – how to analyze it, how it can be used in decision making, and how to tell a story by visualizing data in interesting and informative ways.”
Although all of the workshops have been taught on Zoom due to Covid-19, the TDAI team aimed to make the sessions interactive by encouraging participants to ask questions and provide insight where necessary. This allowed instructors to give live feedback and make sure the participants were understanding the material. Emma Wenckowski, a senior student at Ohio State studying Data Analytics, helped put together material for the Data Literacy Series and played a key part in educating faculty and staff on data training.
“The thing that’s tricky with data analytics is that all of the material exists on the web, but it can seem disorganized, overwhelming, or appear at a level that is too high for beginners,” Wenckowski said. The hope was that the Data Literacy Series would serve as a launchpad for pursuing further data analytics education by showing faculty and staff the possibilities of analysis in R and equipping them with a skillset they could use in the future.
The participants begin with the basics: how to navigate in R Studio and the syntax of R as a programming language before going on to import an example dataset and manipulate the elements of the data. The Statistics session gives participants a refresher of a mid-level Statistics concepts and how to leverage the built-in statistical functions in R. The Data Visualization session introduces participants to the popular ggplot2 package, but most importantly it presents ideas on how to blend the technical and artistic sides of Data Visualization together to create meaningful visualizations.
Both Giglio and Wenckowski were open to feedback and altered the workshops to fulfill the wishes of some attendees. Giglio recalls, “One individual suggested for the introductory to R series that we give real world examples of how and why certain commands would be used. I took this feedback and tailored the subsequent workshops to include examples of how I have used the R commands in my own research or how I envisioned a researcher could use them.”
While the Data Literacy Series has accelerated the learning process for most of its participants, there are still many more opportunities to provide Ohio State faculty and staff with data training. TDAI will continue the Data Literacy Series in 2021 with plans to reach an even larger audience and with different foci – such as highlighting different analysis tools (Excel, SAS) and applications. Plans are also underway to incorporate training modules from the Carpentries, a national organization teaching foundational coding and data science skills to researchers worldwide.
TDAI would like to give a special thanks to Rachael Giglio, Ph.D., Emma Wenckowski, and Lee-Arng Chang for their invaluable help with this Series over the past year.


